
 Need to find something out, just Google it. Now that Google is a verb as well as a noun, it’s easy. But …
It Hasn’t Always Been Easy
Adults under 30, Millennials, grew up with smartphones, laptop and tablet computers, and the Internet. As a group, they’ve never known a time when technology wasn’t integral to their existence. For those of us who finished school before the 1980s, personal computers were a rarity and the Internet was only then being developed for the military-industrial complex. Browsers didn’t appear until the early 1990s. You couldn’t buy a book from Amazon until 1995.
 So, it hasn’t always been easy to find information. For most students, searching for information before 1980 usually involved a trip to the library. There, you would thumb through the 3×5” cards in the drawers of the card catalog looking for information by keywords. You would write down the title of the book referenced on a card along with its location classification (Dewey, Library of Congress). Then you would go to the location in the book stacks and retrieve the book, unless it was already in use, checked out, misplaced, or stolen. Finding enough information to fulfill a need might take hours or days or longer. Then you had to lug the books to a place where you could read them, extract the information you needed, and write it all down on paper. Needless to say, things have changed for the better. Now you can enter your keywords into an Internet search engine, and in a fraction of a second have references to hundreds, if not hundreds of thousands, websites, articles, blogs, books, images, and presentations. You can bookmark sites to read later or just save the relevant information to the cloud. That process might take minutes and will return more relevant information than you could ever access a generation earlier.
What People Looked For
Not only can people search more information sources faster than ever before but now Big Business and Big Government collects data on all those searches. For example, wordpress.com keeps track of the number of visitors to the Stats with Cats b log site, what country they accessed the blog from, the search terms they used to find the site, and the blogs they visited. This is useful because it reveals what people are looking for, at least those people who ended up at the Stats with Cats blog.
Here are the frequencies for pertinent search terms from May 2010 through June 2016 and the associated word cloud (produced at http://www.wordle.net/; works best in IE).
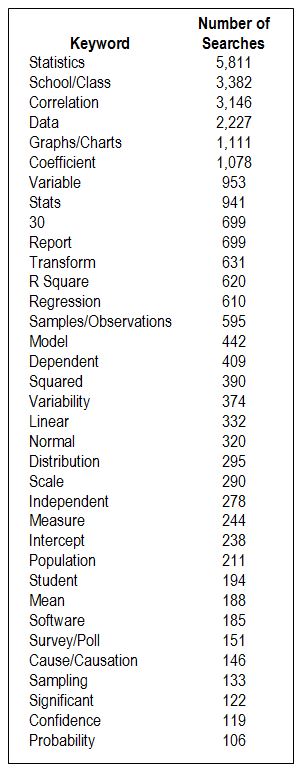 Perhaps not surprisingly, the most common terms are associated with topics students would search if they were confronted with taking their first statistics class – statistics or stats, school or class, graph or chart, data, variable, and correlation. This may reflect the overpowering anticipation of learning about the some of the fascinating aspects of statistical thinking or, more likely, the fear of number crunching.
People searching for “report” are probably trying to figure out how to convert their statistical results into some meaningful story. How to Write Data Analysis Reports is probably much more than they might have expected.
People searching for the number 30 are looking for the reason they were told that their statistical analysis must have at least 30 samples. They might not like the answer at 30 Samples. Standard, Suggestion, or Superstition? but at least they’ll understand where it started, why they keep hearing it, and why the real answer is so unsatisfying.
What They Found
There were over 76,000 referrals from 255 sites, of which 97% came from Google. Bing and Facebook each contributed about 1%. Five Things You Should Know Before Taking Statistics 101 was viewed over 100,000 times in five and a half years. Secrets of Good Correlations had nearly 70,000 views in six years.

The following table summarizes the views and the views per year for 56 Stats with Cats blogs.
The message these statistics are sending appears to be that the Stats with Cats blog attracts introductory students who don’t know what to expect from their statistics class or need help in understanding challenging statistical concepts. In contrast, experienced students are acquainted with more statistics professors and students. They own more statistics textbooks and have visited more educational web sites. And as a consequence, they search for more specific statistical terms, like tolerance limits and autocorrelation, that beginners wouldn’t know. It’s ironic, then, that Stats with Cats was written for students who had completed Statistics 101 and were looking for some help in applying what they had learned. Interesting … sometimes statistical analyses reveal things you don’t expect.

Read more about using statistics at the Stats with Cats blog. Read them to your cats. Join other fans at the Stats with Cats Facebook group and the Stats with Cats Facebook page. Order Stats with Cats: The Domesticated Guide to Statistics, Models, Graphs, and Other Breeds of Data Analysis at amazon.com, barnesandnoble.com, or other online booksellers.


Pingback: Searching for Answers | A bunch of data
As a new person to wordpress and not up to speed on your talk please forgive me in advance for the way I am about to phrase this question. But, there is a reason. The purpose.. the purpose for this question is to see if there is a way to determine if “working” or “hiring” certain persons will have a “more or less” favorable outcome of an event taking place.
The focus of the data is the collection of persons that hold certain positions in government, persons that have certain jobs in the private sector, the “rezoning request” of land, the “approval” of such rezoning or permit use process. (permit use meaning the right to use the land”.
The data sets would be derived from the County records in U.S. State of California, the County of Calaveras.
Collecting public information is long and tedious but available.
Now to the point. How would one set up the “form and formula” to input the data.
I remember taking a stats class but had a statistical calculator that did the heavy lifting. And the only correlation example I remember was that which used age, height and weight given a plus or minus variable.
I guess the hypothesis would be are certain politicians favoring certain people who request land use vs others that are not in the politicians favor.
Another hypothesis would be do certain Nationalities have a better chance at getting land projects approved or land rezoned vs other Nationalities.
And on and on…